Showing posts with label itulip. Show all posts

26 September 2009

iTulip.com Gold Myths Cheat Sheet


http://docs.google.com/fileview?id=0B3gFAVhH-wC6ZjA2YzQyZTYtZTY4Zi00MGJmLTk1ZDMtZjIwODI0YWE0MjYz&hl=en

iTulip.com Gold Myths Cheat Sheet

An eight-year-old bull market in gold has spawned more erroneous theories and timing calls along the way than you can count. We break it down to the Top Eight Myths and recount the consensus opinion on gold since the bull began in 2001.

Here are eight popular myths about gold that we have collected since 2001 when we put 15% of our portfolio into the yellow metal (with the iTulip counter-argument in parentheses):

A. Earns no interest. (Gold has out-performed stocks and bonds every year since 2001 in real terms.)

B. Performs poorly on the long term. (True, unless the currency is in long term decline due to structural economic imbalances and negative interest rates are maintained for extended periods to stimulate economic growth of the imbalanced economy.)

C. Better inflation hedges exist, such as TIPS. (Inflation is a secondary effect of a weak currency. Gold hedges dollar currency risk directly, inflation risk indirectly; dollar denominated bonds cannot.)

D. Is money (In order to qualify as money gold must act as both a store of value and means of exchange. We use cigarettes in a prison as an example. You must convert gold to dollars before you can make purchases in the U.S. so gold only meets the first criteria. Gold is a currency. We call it the Fourth Currency because it competes with the dollar, euro, and yen in international currency markets.)

E. Price is primarily determined by physical demand for gold. (That's backwards. The gold price is primarily determined by global demand for the currency that is used as the unit to measure the gold price.)

F. The dollar will strengthen relative to other currencies and push down the dollar price of gold. (The dollar's long-term value is determined by international political relationships. Its short-term price is influenced by economic events. The long-term trend is negative because the dollar is a reserve currency nearing the end of its life span. Short-term value fluctuations are irrelevant to non-traders.)

G. Asset price deflation will result from a collapsing credit bubble. Central banks cannot contain the asset price deflation. It will spill over into wage and commodity prices and crash the price of gold. (Central banks can create infinite money through the process of double entry bookkeeping. Consider, for example, TARP.)

H. The smart moneys wait for F. and G. to happen before taking a position in gold.
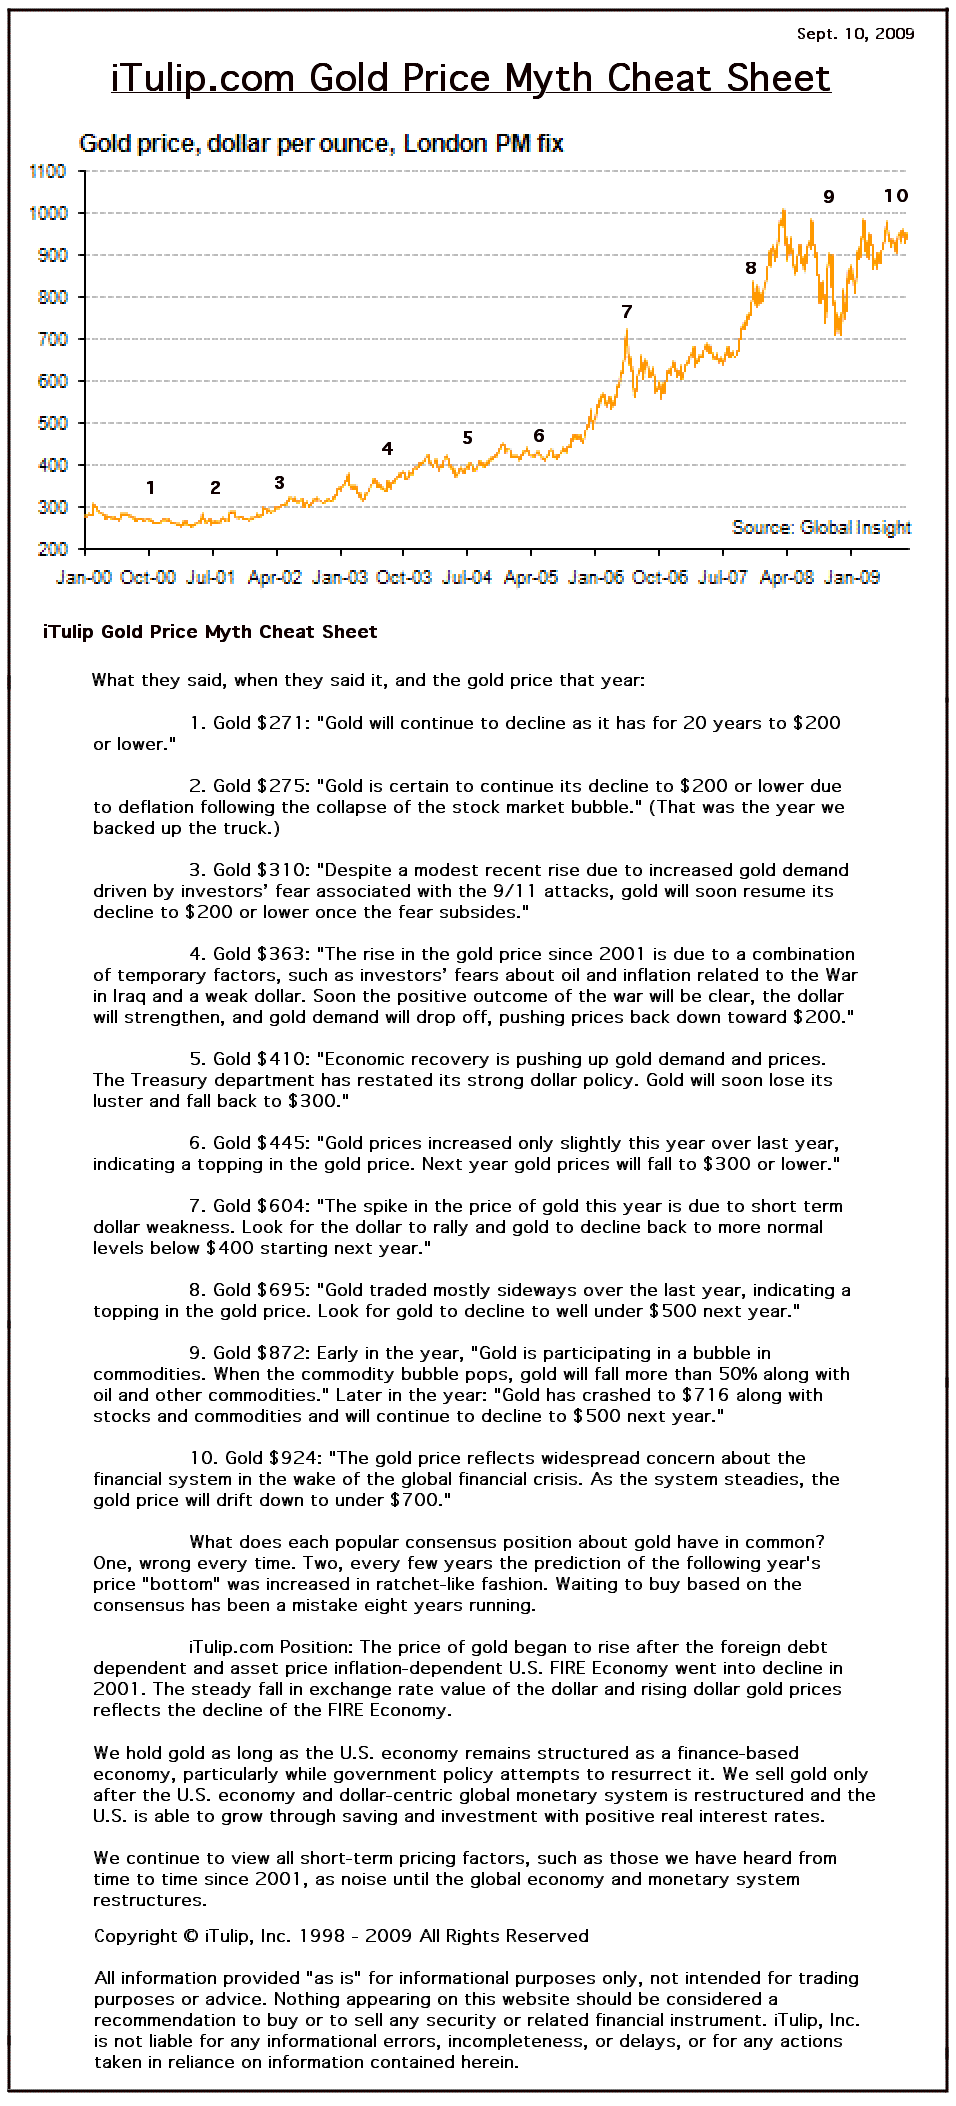
Below we list the popular consensus about gold that we heard over the years since 2000, prefaced by the cumulative average gold price that year.

What they said, when they said it, and the gold price that year:
1. Gold $271: "Gold will continue to decline as it has for 20 years to $200 or lower."

2. Gold $275: "Gold is certain to continue its decline to $200 or lower due to deflation following the collapse of the stock market bubble." (That was the year we backed up the truck.)

3. Gold $310: "Despite a modest recent rise due to increased gold demand driven by investors’ fear associated with the 9/11 attacks, gold will soon resume its decline to $200 or lower once the fear subsides."

4. Gold $363: "The rise in the gold price since 2001 is due to a combination of temporary factors, such as investors’ fears about oil and inflation related to the War in Iraq and a weak dollar. Soon the positive outcome of the war will be clear, the dollar will strengthen, and gold demand will drop off, pushing prices back down toward $200."

5. Gold $410: "Economic recovery is pushing up gold demand and prices. The Treasury department has restated its strong dollar policy. Gold will soon lose its luster and fall back to $300."

6. Gold $445: "Gold prices increased only slightly this year over last year, indicating a topping in the gold price. Next year gold prices will fall to $300 or lower."

7. Gold $604: "The spike in the price of gold this year is due to short term dollar weakness. Look for the dollar to rally and gold to decline back to more normal levels below $400 starting next year."

8. Gold $695: "Gold traded mostly sideways over the last year, indicating a topping in the gold price. Look for gold to decline to well under $500 next year."

9. Gold $872: Early in the year, "Gold is participating in a bubble in commodities. When the commodity bubble pops, gold will fall more than 50% along with oil and other commodities." Later in the year: "Gold has crashed to $716 along with stocks and commodities and will continue to decline to $500 next year."

10. Gold $924: "The gold price reflects widespread concern about the financial system in the wake of the global financial crisis. As the system steadies, the gold price will drift down to under $700."

What does each popular consensus position about gold have in common? One, wrong every time. Two, every few years the prediction of the following year's price "bottom" was increased in ratchet-like fashion. Waiting to buy based on the consensus has been a mistake eight years running.

iTulip.com Position: The price of gold began to rise after the foreign debt dependent and asset price inflation-dependent U.S. FIRE Economy went into decline in 2001. The steady fall in exchange rate value of the dollar and rising dollar gold prices reflects the decline of the FIRE Economy.

We hold gold as long as the U.S. economy remains structured as a finance-based economy, particularly while government policy attempts to resurrect it. We sell gold only after the U.S. economy and dollar-centric global monetary system is restructured and the U.S. is able to grow through saving and investment with positive real interest rates.

We continue to view all short-term pricing factors, such as those we have heard from time to time since 2001, as noise until the global economy and monetary system restructures.

25 September 2009

Wrecking the world’s greatest economy

ND: Do you miss the old Hunter Thompson as much as I do?
EJ: Last week I listened to a recording of a lecture he gave at Boulder University in 1977 after he published Fear and Loathing in Las Vegas. At one point a student in the audience asks if there is anything that he as a young person heading out into the world can do to help get the U.S. off the self-destructive course that Thompson describes in his book. Thompson is fatalistic. He says, no, there is not, that the crazed system is destined to go on and on until it blows itself up and burns itself out. Looks like he was right.

ND: We blew it. The media, I mean.
EJ: We use this catch phrase at iTulip: “Who could have known?” to refer to any obvious outcome of excess and fraud over the past 11 years that we've been in operation. Anyone reading our site—and plenty of others—since 1998 could see the current crisis coming down hard on us, but not if they only read mainstream papers or watched cable or network TV. After a string of failures to protect the public from cheats, crooks, and liars—the primary role of the media—a cloud of suspicion hangs over the whole industry. On top of the business model challenges created by the Internet, there’s a real crisis of credibility. Today they’re backpedaling as hard and fast as they can, and maybe readers will forget that the media hung them upside down to have their pockets picked by mortgage brokers and stock jobbers selling the American dream as a debt they can’t repay and a stock portfolio that vaporizes as soon as they reach retirement age. It's a safe bet they will forget.

ND: Who’s doing a good job today?
EJ: The Wall Street Journal is doing a good job of covering the crisis now that it’s here. Plenty of thoughtful skepticism about the recovery. But the fact remains that the savings of a generation of our middle class was wiped out by the stock and housing bubbles. Failure by the media to expose the frauds while they were being perpetrated has caused millions to lose faith in the mainstream media.

ND: Who will take its place? Glenn Beck and Alex Jones?
EJ: The average American doesn’t know how to be intelligently skeptical. They lack the tools. Their schooling taught them to believe what they read in the paper and watch on TV and are told by anyone in a uniform or anyone who makes more money than they do. For example, the mortgage broker in a suit who told them not to worry about exaggerating income in order to qualify for a ridiculously huge mortgage. You can say these people were stupid for trusting the brokers and the appraisers and the lawyers and all of the other conspirators to the gigantic fraud that came to be known as the housing bubble, including the media that used to quote the National Association of Realtors as a source of information about the safety of housing as an investment. That’s journalism? But who is the public supposed to trust? No one? So now the public doesn’t trust anyone. Why should they? But in the wake of these frauds they lack the tools necessary for critical evaluation of even the most basic data about their economy, never mind complicated issues like monetary policy, inflation, and employment. In this environment guys like Glenn Beck and Alex Jones thrive.

ND: Where is this headed?
EJ: When the people lose faith, they do not then believe in nothing. They believe in anything. Between an oligarchic government controlled media and a public unable to distinguish between an argument made on evidence and one based on speculation, I believe we are heading into an era of rising nationalism and unreason unlike anything we have seen since the 1930s. The antecedents are exceedingly dangerous. Our polity can be whipped up into a frenzy to do just about anything.

ND: Where is the leading edge of rising nationalism?
EJ: Japan just elected the first government since the end of WWII that represents a break from alignment with the U.S. The election was a big deal in Asia. The winning platform was distance from Washington and separation from Wall Street.

ND: Japan was hit especially hard by the global recession that we caused.
EJ: True, but it’s important to remember that our economic relationship with Japan has been difficult since at least the Kennedy administration.

For U.S trade partners like Japan, the U.S. has been like a very large and important customer that delivers most of the revenue to a goods manufacturer. Endlessly demanding, at times irrational and occasionally dangerous, our behavior was tolerated for one and only one reason: we, the customer, always placed our order by the end of the quarter. All was forgiven.

Then the 2008 crisis came. We, as a major customer to our global trade partners, have always been difficult to do business with, but at least we were worth it for the orders, even if they had to provide much of the financing. But since U.S. consumer demand for imports fell off a cliff last year, we’re not worth the trouble.

Yet our demanding and irrational behavior continues as if we were still the world’s most important customer or we will regain that status shortly, if only we print and borrow enough money to get households borrowing and buying again. The perpetuation of this delusion will end in tears.

ND: What did we do to Japan under the Kennedy administration? I don't remember that.
EJ: In my research I came across a reference on Sony Corporation’s web site that stated that Japan's 1965 economic depression was rooted in the interest equalization tax instituted two years earlier by President John F. Kennedy. The U.S. economy was in recession and domestic capital was pouring out of the country. Kennedy imposed a 16.5% interest equalization tax on all capital leaving the U.S. to slow the outflow--basically, a capital control. The law succeeded in decreasing the outflow of U.S. capital but it also caused a panic in world stock markets. In 1965, Japan’s securities market crashed and Japan had its worst depression since The Great Depression.

While it’s tempting to see events like the election of an anti-U.S. government in Japan as a recent development, the issues between the two countries that led to that outcome have been brewing for decades. The 1980s bubble and crash was also a product of U.S. policy. Political change, such as shown in the election of a new government in Japan, appears sudden if you haven’t followed the history and antecedents.

After this latest U.S. financial and economic debacle that cratered Japan’s economy, the Japanese people decided they’ve had enough.


A must read continues

2 August 2009

Gold Techs, Kapoom Theory....

But this is no more than an argument that the U.S. is not likely to experience a replica of an Argentina 2001 debt and currency crisis, and of course that is true. But that does not mean that a related, equally unseemly but fundamentally different catastrophic result may follow from similar causes and crisis triggers. Evidence abounds that the U.S. is trapped in a cycle of economic contraction and declining creditworthiness from which an Argentine style default with U.S. characteristics is all but inevitable.

Here we take a deep dive into the macro economics of the Argentine crisis—GDP growth, consumption, investment, inflation, industrial production, unemployment and a dozen other details of the Argentine economy in the period before it collapsed at the end of 2001. We compare the same macro economic measures during the U.S. economic crisis that started in 2008.

A few items, such as currency reserves, stand out in ways that show how different the U.S. situation is now from Argentina’s then, but most of the macro economic comparisons reveal astonishing similarities, especially measures of output and inflation.


http://www.itulip.com/forums/showthread.php?p=106493#post106493

GOLD

LONG TERM

The long term P&F chart is still in a bullish phase but it has now set a new upper support at the $915 level. A move to $900 would break below the support and two previous lows as well as an up trend line for a trend reversal signal. Just something to keep in the back of one’s mind if the price should start to drop.

As for our normal chart and indicator analysis, things are still a-okay for now. The price of gold remains above its positive sloping moving average line and the long term momentum indicator (daily version) remains in its positive zone above its positive trigger line. The volume indicator is at its highest point since its highs in late February and is above its long term positive trigger line. Nothing here yet to get worried from the long term standpoint. The rating remains BULLISH.

INTERMEDIATE TERM

Since the end of January the price of gold has been basically in a wide lateral drift with the upper and lower barriers at about the $1000 and $870 levels. I guess as long as it remains in this box, with the right wall continually moving further to the right, it would be hard to really guess which way the eventual direction of future trend will be.


While in this box the intermediate term moving average line will move in a basically lateral direction and the price of gold will continue to fluctuate above and below the moving average line. This makes it very difficult to definitively gauge the influence a crossing of the moving average line by the price will have. So, although I will continue with my normal commentary as to the positive or negative nature of the price versus its intermediate term moving average line one should keep in mind this box situation. An intermediate term trend will most likely start inside the box but its confirmation must await a move outside the box.

Having given myself the cop-out excuse in case my analysis is wrong, let’s go to the intermediate term analysis.

The price of gold has once more moved above its moving average line and the line slope is once more in the positive direction. The momentum indicator has set up a strong support just above the 48% level. This would be a level to watch (instead of the 50% level) for a real change in strength of the price move. In the mean time the momentum continues in its positive zone above its positive trending trigger line. The volume indicator is also trending positively and remains above its positive sloping trigger line. All normal indicators give me an intermediate term rating as BULLISH, at this time.

SHORT TERM

From the short term perspective we are still in good shape. The price remains above its positive trending moving average line and the momentum indicator remains in its positive zone just above its positive trigger line. As for the daily volume action, well that could be a little better but I wouldn’t complain yet. All in all, the short term rating is BULLISH.


As for the immediate direction of least resistance, that’s another story. We have the price above its very short term positive moving average line (8 DMAw) while the line remains above the short term line. However, if one looks carefully the moving average line has started its turn towards the negative (although it’s not there yet) in keeping with the lateral move of the price over the past few days. Of greater concern is the action of the more aggressive Stochastic Oscillator. It had topped out in its overbought zone and has now dropped below the overbought line and its trigger line. It is now heading lower. This is too often a precursor to a turn down in the price, at least for a short while. So, I must go with the down side as the direction of least resistance until something in the indicators changes.

SILVER

First, a quick comment on my P&F chart of silver. It has set up a strong support at the $12.00 level. A move to $11.50 would break that support and would break below an up trend line. From a P&F standpoint this is the level to watch. Until then silver remains long term bullish, P&F wise.

Silver still has a better performance versus gold over the intermediate and long term but is losing its advantage. Although this past week it performed better than gold it still has some catching up to do from the shorter term standpoint. A comparison of the two short term charts here shows that silver dropped more than gold in June and although it is recovering nicely these past two weeks it is a catch-up game and still better performance is required.


From a long term perspective silver had dropped below its moving average for a couple of weeks in early July but is back above the moving average. The average continues to slope upwards. The momentum indicator also dropped into its negative zone at the same time but is also back into the positive, above its positive trigger line. For the long term the rating is back into a BULLISH rating.

The intermediate term is not quite so lucky. Although the momentum indicator has moved back into its positive zone and above its positive trigger line the price of silver remains just below its intermediate term moving average line. The line itself is still in a negative slope. The volume indicator has been moving in a basic lateral direction over the past couple of months although it is presently above its positive sloping trigger line. On the intermediate term the best I can give the rating is a – NEUTRAL rating. Next week, should the price of silver advance again most likely this rating will go full bullish. But we’ll have to wait for it.

The short term is more encouraging. It often tells us what’s ahead for the other time periods. The price is above its moving average line and the line is sloping upwards. The very short term moving average line remains above the short term line for a direction confirmation. The momentum indicator is in its positive zone above its positive trigger line and heading higher. Only the daily volume activity could be a whole lot better. The recent two week advance in price was not accompanied by any significant increase in volume activity, in fact the daily volume seemed to have dried up. This is a real concern for the longevity of this rally. In the mean time the short term rating is BULLISH.


http://www.kitco.com/ind/burak/jul272009.html
Each major bear market in the D. J. I. A. has been accompanied by a bull market in gold and gold shares. The first two major bear markets in the D. J. I. A. did not end until the bottom green area was violated. The third and current major bear market has not yet gone below the bottom green area. This is powerful evidence that the bear market may not be complete but is ongoing.
Based on the previous bull markets in gold and gold shares the current gold bull market will not end until after the bear market in the D. J. I. A. ends.

http://www.kitco.com/ind/rosen/jul272009.html

21 November 2008

Debt Deflation Bear Market Update Part I: 2009 Windup

Eric,

After hearing you warn us about the stock market for years, we got out when I read your article “Beware Relief Rallies” after the DOW rallied to 9625 after the election. That was it for me! My “puke point” as you once put it. I sold that day. I should have gotten out in 2007, but better late than never. My wife and I are now entirely in Treasury bonds and CDs. We told our financial planner and this is what he said about our decision. Can you comment on it, please? Thanks.

Signed,
Your Friend
Financial Planner’s note to my Friend:
Dear Client,

You are right in that you will not be successful timing the market. You will come out ahead while the market is down but you will lose out to those who stayed in when it goes back up.

As we have discussed in working with older clients and their portfolios, a better approach is to take out enough cash to cover your needs (i.e., the amount of cash you need beyond what you are reasonably sure you will take in from income, bonuses, commissions, etc.) for however long you think it will take for the market to recover.

We estimate that it will take 3-5 years for the market to come back. If you plan to retire and your expenses exceed income by $10,000 per year, we advise you to take $50,000 out of the market to invest in CDs and Treasury bills.

The other thing you can do is use a more conservative balancing formula. For example if you are in your 50s nearing retirement and have been following an approach weighted towards growth equities, you might move to less in growth equities and more in bonds.

The only reason to sell everything and keep only cash (CDs and T-bills) is if you think the world is done growing, that we have all we need and that the minimalist life-style will prevail wholesale for all the time to come that matters to you (i.e., your lifetime). Ok?

Signed,
Your Financial Planner
My response to my Friend regarding his Financial Planner’s advice:
Friend,

The idea that markets cannot be timed and that the smart investor buys and holds stocks and never sells is based on two fallacies: one, efficient market hypothesis, and two, that the world does not ever change in significant ways that are bad for stocks for very long periods of time.

As everyone who knows me knows, I got out of the broad stock market in 1998 when the S&P was, believe it or not, higher than it is today in nominal terms. That was ten years ago.

Now add in the cost of inflation. On a CPI inflation-adjusted basis, the market was 48% higher in 1998 than it is today as the purchasing power of the S&P has declined that much since then. This is a sad state of affairs but indisputable by the facts of the matter: any asset that merely kept up with inflation, such as gold, did better than stocks over the past ten years. No secret either that I also got out of the NASDAQ in March 2000 when it was trading around 4,500 (see 2002 Boston Globe story) and got into Treasury bonds in late 2000. Finally, I took a 15% position in gold in 2001 when it was trading at $265 (See Questioning Fashionable Financial Advice: Gold - September 2001).

That’s it for me and the stock market. I never got back in and remain in Treasuries and CDs, along with, as my friend in London Dr. Peter Warburon put it, a “rump of gold."

Why no stocks after 2001? Because after the technology bubble crash I expected the government to create via tax cuts, rate cuts, and stealth dollar devaluation a reflation boom like the 1934 - 1937 reflation created after the 1929 stock market bubble bust. Like that reflation the stock market after 2001 was unlikely to produce meaningful inflation-adjusted returns over boring old safe bonds. So why bother? Worse, I knew that the stock market boosted by inflation was not sustainable; I did not expect to be able to time the eventual second collapse and get out int time. That's right, I worried that I can't time the market either–when to get back out of it, that is.


That forecast back in 2001 was complicated by the housing bubble, the most idiotic and irresponsible act of government economic manipulation in world history and completely beyond me to predict. Not even in my darkest dreams did I think our Federal Reserve and banking regulators could be so stupid: bursting real estate bubbles bring down banking systems and economies. They did in the US in the 1870s and 1930s, in Japan since the 1990s, and many other nations as well. The US 2002 to 2006 housing bubble extended the tax cut, rate cut, dollar devaluation reflation boom by two of years longer than the 1930s version sans housing bubble. As you can see, that extension made the collapse we are seeing today considerably more severe.

Now we have a post bubble reflation boom crashing around the fake boom created by the technology stock bubble-two crashes nested one within the other–thus the terrific cascading financial and economic collapse we see today.

We wrote dozens of occasionally over-the-top, but always factual and data driven warnings on iTulip.com since March 2006 to try to scare readers out of the stock market. As it turns out, we were able to determine and notify subscribers on Dec. 27, 2007 when the DJIA was trading at 13,365 that, if they were for some crazy reason still in the market, that was it: the last chance to get out.

That forecast was informed primarily by two pieces of information.

One, our research told us that US markets were likely to begin in 2008 to experience a bear market that more or less tracked the Nikkei during the first year of the Japanese debt deflation in 1990, off 40%. Here’s the first chart we posted then to mark the starting point of what we called the Debt Deflation Bear Market.


Original chart from Dec. 27, 2007 iTulip Select article notifying subscribers of the start of Debt Deflation Bear Market in 2008 comparable to the Nikkei 40% decline in the first year of the Japanese debt deflation in 1990.

Here is the chart updated as of November 19, 2008.


Debt Deflation Bear Market update as of Nov. 19, 2008

Yes, we know. “No one has a crystal ball” and “no one can foresee the future of the markets.”

Is that what your financial planner told you?

We hear that all of the time that no one can forecast the markets, certainly not to this degree of accuracy. But this forecast was uncomplicated if you understood the simple underlying dynamic: US households and businesses, and the government itself, had since 1980 built up too much debt. The rate of increase in debt was unsustainable.

The credit bubble began in 1980 after the Fed raised short term interest rates to 19%. The 1975 to 1980 inflation that proceeded that drastic action deflated all the debt in the economy, leaving US households and businesses with a clean slate. The “fat spread” between high but falling wholesale borrowing rates paid by banks and more gradual declines in rates paid by retail borrowers made lending very profitable and vastly expanded credit and purchasing power and, with it, increased debt. Once the "fat spread" effect ran out in the early 1990s, bank reserves rules were changed to extend the credit boom. Once those benefits ran out in the early 2000s, lower lending standards, low interest rates, and financially engineered debt products together enabled by newly deregulated debt markets, extended the credit boom for one final spurt of growth. At its height, the US credit machine was producing five dollars of new debt for every dollar of GDP growth, up from a ratio of one to one in the 1960s.

The entire 27-year old edifice of debt came crashing down starting with the crash of the securitized debt market in Q1 2007. It was game over and 2008 was the first year of the American debt deflation.

All credit bubbles end with a sudden withdrawal of purchasing power from the markets and economy that have become dependent on the massive flows of fresh credit. Debt deflations go on and on until the debt is deflated, one way or another, either by monetary deflation and debt defaults as in the 1930s or by monetary inflation as occurred between 1975 and 1980 in the US. The Japanese have since 1990 deflated debt the slow, hard way, siphoning off cash flow from households and businesses for nearly two decades to pay it all down, and in the process transferring mountains of private debt to the federal government through public spending programs. Our government is hoping to do that, too, except unlike Japan in 1990 our government is deeply in debt to foreign private and official lenders already.

If somehow we manage to pay our debt down the hard way as Japan has over nearly two decades, what was Japan’s reward for toughing it out? The Nikkei is today at 8,273 after reaching 39,000 at the end of 1989, off 80% in nominal terms in 19 years.

The first relevant fact in our Dec. 27, 2007 Debt Deflation Bear Market forecast was that the US is entering a debt deflation and that debt deflation is the worst possible investment environment for a buy-and-hold strategy.

Two, contacts on Wall Street conveyed in many ways, some subtle and others not, that a last ditch effort was on to run up the market going into the end of the fiscal year in 2007 to collect the last bonuses that the current generation of bankers expected to see before Wall Street went down for the count in 2008. So much for efficient markets. Quite a few are unemployed now. Some of the analysts I know from Lehman landed at Barclays, a few bearish and therefore well-positioned hedge fund managers did well shorting stocks and are still active, and a few old contacts at JP Morgan and Goldman Sachs are still there, but I can’t imagine the industry will ever be the same.

Huge imbalances in the US and global economy developed for over 30 years. Now they are rebalancing, as many non-mainstream economists have warned was certain to happen sooner or later, which warnings were argued as alarmist by mainstream economists. The global monetary system cobbled together in the 1970s after the US unilaterally abandoned Bretton Woods, and the unintended consequences of that -- the inflated purchasing power of the US dollar, buildup of gross external debt to 95% of GDP, and America's gigantic current account deficit -- started to come apart in 2007 following the crash of the securitized debt market, that followed the collapse of the housing bubble. It had to come apart anyway; the securitized bond market happened to be the proximate cause.

For a historical perspective on these events, see the attached charts, five of hundreds that have gone into our analysis.

The first is a measure of the response of the Fed to the recent crisis in the US banking system showing total reserves of the Fed system going back to 1928.


Obviously, a historically unprecedented event has occurred but no one can say what it means long term. Whatever it means, it's not positive for the stock market.

The second chart shows industrial production and duration of unemployment in each of the last eight recessions since 1954.


Note that duration of unemployment, a lagging indicator, is only ever briefly rising during a complete economic cycle while industrial production is falling, always during the recession. Not this time. Falling industrial production and unemployment have been coincident for an extended period so far during this recession.

Our interpretation of this is that unemployment will rise precipitously for at least the next year (see Unemployment by industry: Recession or depression?), given data like that shown in chart three below: light truck sales unit volumes are already down to 1983 levels.


The reason retail sales are plummeting, as indicated by light truck sales, is that a large portion of the extension of purchasing power to households and business by borrowing was suddenly withdrawn this summer by the credit market crash. That crash came on top of a recession that started in Q4 2007 as we forecast in Oct. 2006.

Why did the credit markets crash? The credit market is best understood as a transactions network. One node or set of nodes crashes, and in the process transmit the information that caused the crash to other nodes. Entire sections of the network crash and become inoperative while others continue to function, which explains why credit continues to flow almost normally in some credit markets that function as more or less autonomous sub-networks. However, eventually the entire network may fail, with only a few isolated sub-networks functioning, and large sections of the US economy will devolve into operating on a cash-only transaction basis as has occurred in other instances of credit market breakdown in other places in the world.

This was, by the way, why I supported the original stinky Paulson emergency bailout plan. Not that I love Paulson or what he represents but after I interviewed Dr. Peter Warburton at the time (See Inside the Whirlpool: Interview with Dr. Peter Warburton $ubscription) who wrote the book on the flawed modern credit system in Debt And Delusion in 1999 and forecast this debacle years before anyone else, I realized that there was a moment when rebooting the first set of crashed credit system network nodes quickly might have prevented a systemic credit network failure. Paulson did not have time to put together an elegant plan or present it well, and Congress gagged and chattered while the network melted down those first few days. Might the $700 billion bailout have worked if immediately applied versus two weeks after proposed? We’ll never know. Now Paulson stands accused of bait and switch, when in fact months ago the time passed when the $700B emergency credit network reboot might have worked. Now he can either return the money and explain “too late” or keep it and try to use it for some other purpose. What would you do?

This mismatch between the speed of the political process and the rate of financial meltdown function was a key feature of the early 1930 credit bubble collapse and response. Experts like Professor Irving Fisher who understood what was going on and what to do were unable to influence Congress in time. He pushed in early 1930 for the US to drop the gold standard and inflate as most other nations were doing. Those countries escaped the worst of the depression. That was finally done in 1933 by FDR, but only after the economy had collapsed. I expect a rerun: Congress will finally do the right thing–find a way to cancel the debt that is choking the economy to death–but only after the economy has virtually collapsed.


What can the Fed do? Not much on the orthodox reflation front. Chart four shows the effective Fed Funds Rate, for all practical purposes at zero. No more stimulus there. Yesterday Federal Reserve Don Kohn admitted that the Fed was engaged in quantitative easing "and should prepare for the possibility that more extreme measures could be needed to guard against deflation," as reported in the Financial Times. This marks perhaps the fifth or sixth action that the Fed has taken, along with Fed purchases of deflating assets, that our friends in the deflation camp said would never, ever happen. What impact will these measure have on stock prices? I don't know about you but I think I'll wait out the trial and error radical monetary experiments.

Chart five shows major dislocations in TIPS yields and prices. Credit market sea level is not supposed to move this way.


What is the TIPS market saying? Nothing good for the stock market, I can assure you. You can interpret this either as the bond market smelling a repeat of 1930s deflation or late 1970s inflation times two or three. Hoover or FDR? Pick your poison. I expect Hoover then FDR, disinflation then inflation ala late 1970s but more extreme, to deflate the debt.

Everywhere you look you will find anomalies and indications of extraordinary knock-on effects of the global credit crisis, and plenty of evidence of self-reinforcement between real economic activity and asset price deflation, such as the Baltic Dry Goods Index.

Will these market and economic anomalies diminish, the markets recover, and the economy return to normal within the timescale of the 50 or 60 year old buy-and-hold stock investor? Perhaps, but just more likely a transformation of the entire structure of the global markets and economy is starting that will take decades to resolve.

In my view, these historic events will next year be complicated by political responses to high unemployment globally, and it is reasonable to expect that some of these responses will not be entirely constructive.

The stock market buy-and-hold era ended in 1998. In a world where the so-called business cycle is dominated by bubbles, inflation, crashes, deflation, recession, and reflations and all manner of government interference, stock market timing, and sector analysis, will continue to be the key to making money. In fact, across the broad stroke of American history, there is never a period when markets are not either largely or entirely influenced by the actions of government. For hundreds of years the US has either been at war, recovering from war, growing asset bubbles, crashing asset bubbles, recovering from asset bubbles, or mucking around with the monetary system–entering the gold standard, leaving the gold standard, entering into a new global monetary regime, leaving that regime–endlessly. How can markets possibly be efficient if they are perpetually driven by large-scale events produced by government policies? The idea is profoundly naive.

On a final note, given what were to me and many others glaringly obvious risks with predictable outcomes for the stock market going back to 1998 when I got out of stocks and started iTulip.com and the horrific advice that many certified financial planners have given their clients over the years, I wonder if the licensing of financial planners has operated for the last decade as a scheme to create an unwitting, unified Wall Street financial products sales force as an independent, disinterested, and expert -- and therefore unquestioned -- collection of investment professionals with only their clients’ best interests at heart. Except for the few renegade licensed financial planners and high end wealth managers who escape the indoctrination with an ounce of common sense, most doggedly stick to absurd investment theories like “efficient markets” that have no relevance in the real world, follow arbitrary portfolio balancing rules that just happen to favor a large stock market position no matter that a large cash position is warranted by clearly observable risks, and express antagonism toward asset classes such as precious metals that, unfortunately, have a legitimate place in the portfolio of any citizen of a government that has a printing press and knows how to it, that is, all of them.

For their part, the clients of financial planners and wealth managers need to stop insisting that their money always be producing yield, even under circumstances of "bubbles in everything" as occurred in 2006 and 2007. The client thinks, "I don't pay you to manage cash. Put my money to work!" Investors need to accept the fact that sometimes preserving your wealth in cash is the best work your money manager can do.

The financial mayhem the majority of financially planners have unleashed upon the portfolios of millions of Americans over the past year informs my view that the entire financial planning licensing system should be abandoned and replaced with a simple referral system that qualifies financial planners entirely on performance based metrics, not abstract theory that favors one asset class over another.

No one expects a perfect crystal ball, but going to cash to dodge a 40% correction in 2007 was not rocket science. All you had to do was look at all the debt: there was and is too much of it, and there is no way that the unwinding of all that debt can possibly be good for stocks. That’s just common sense.

Sincerely,

Eric

charts and link